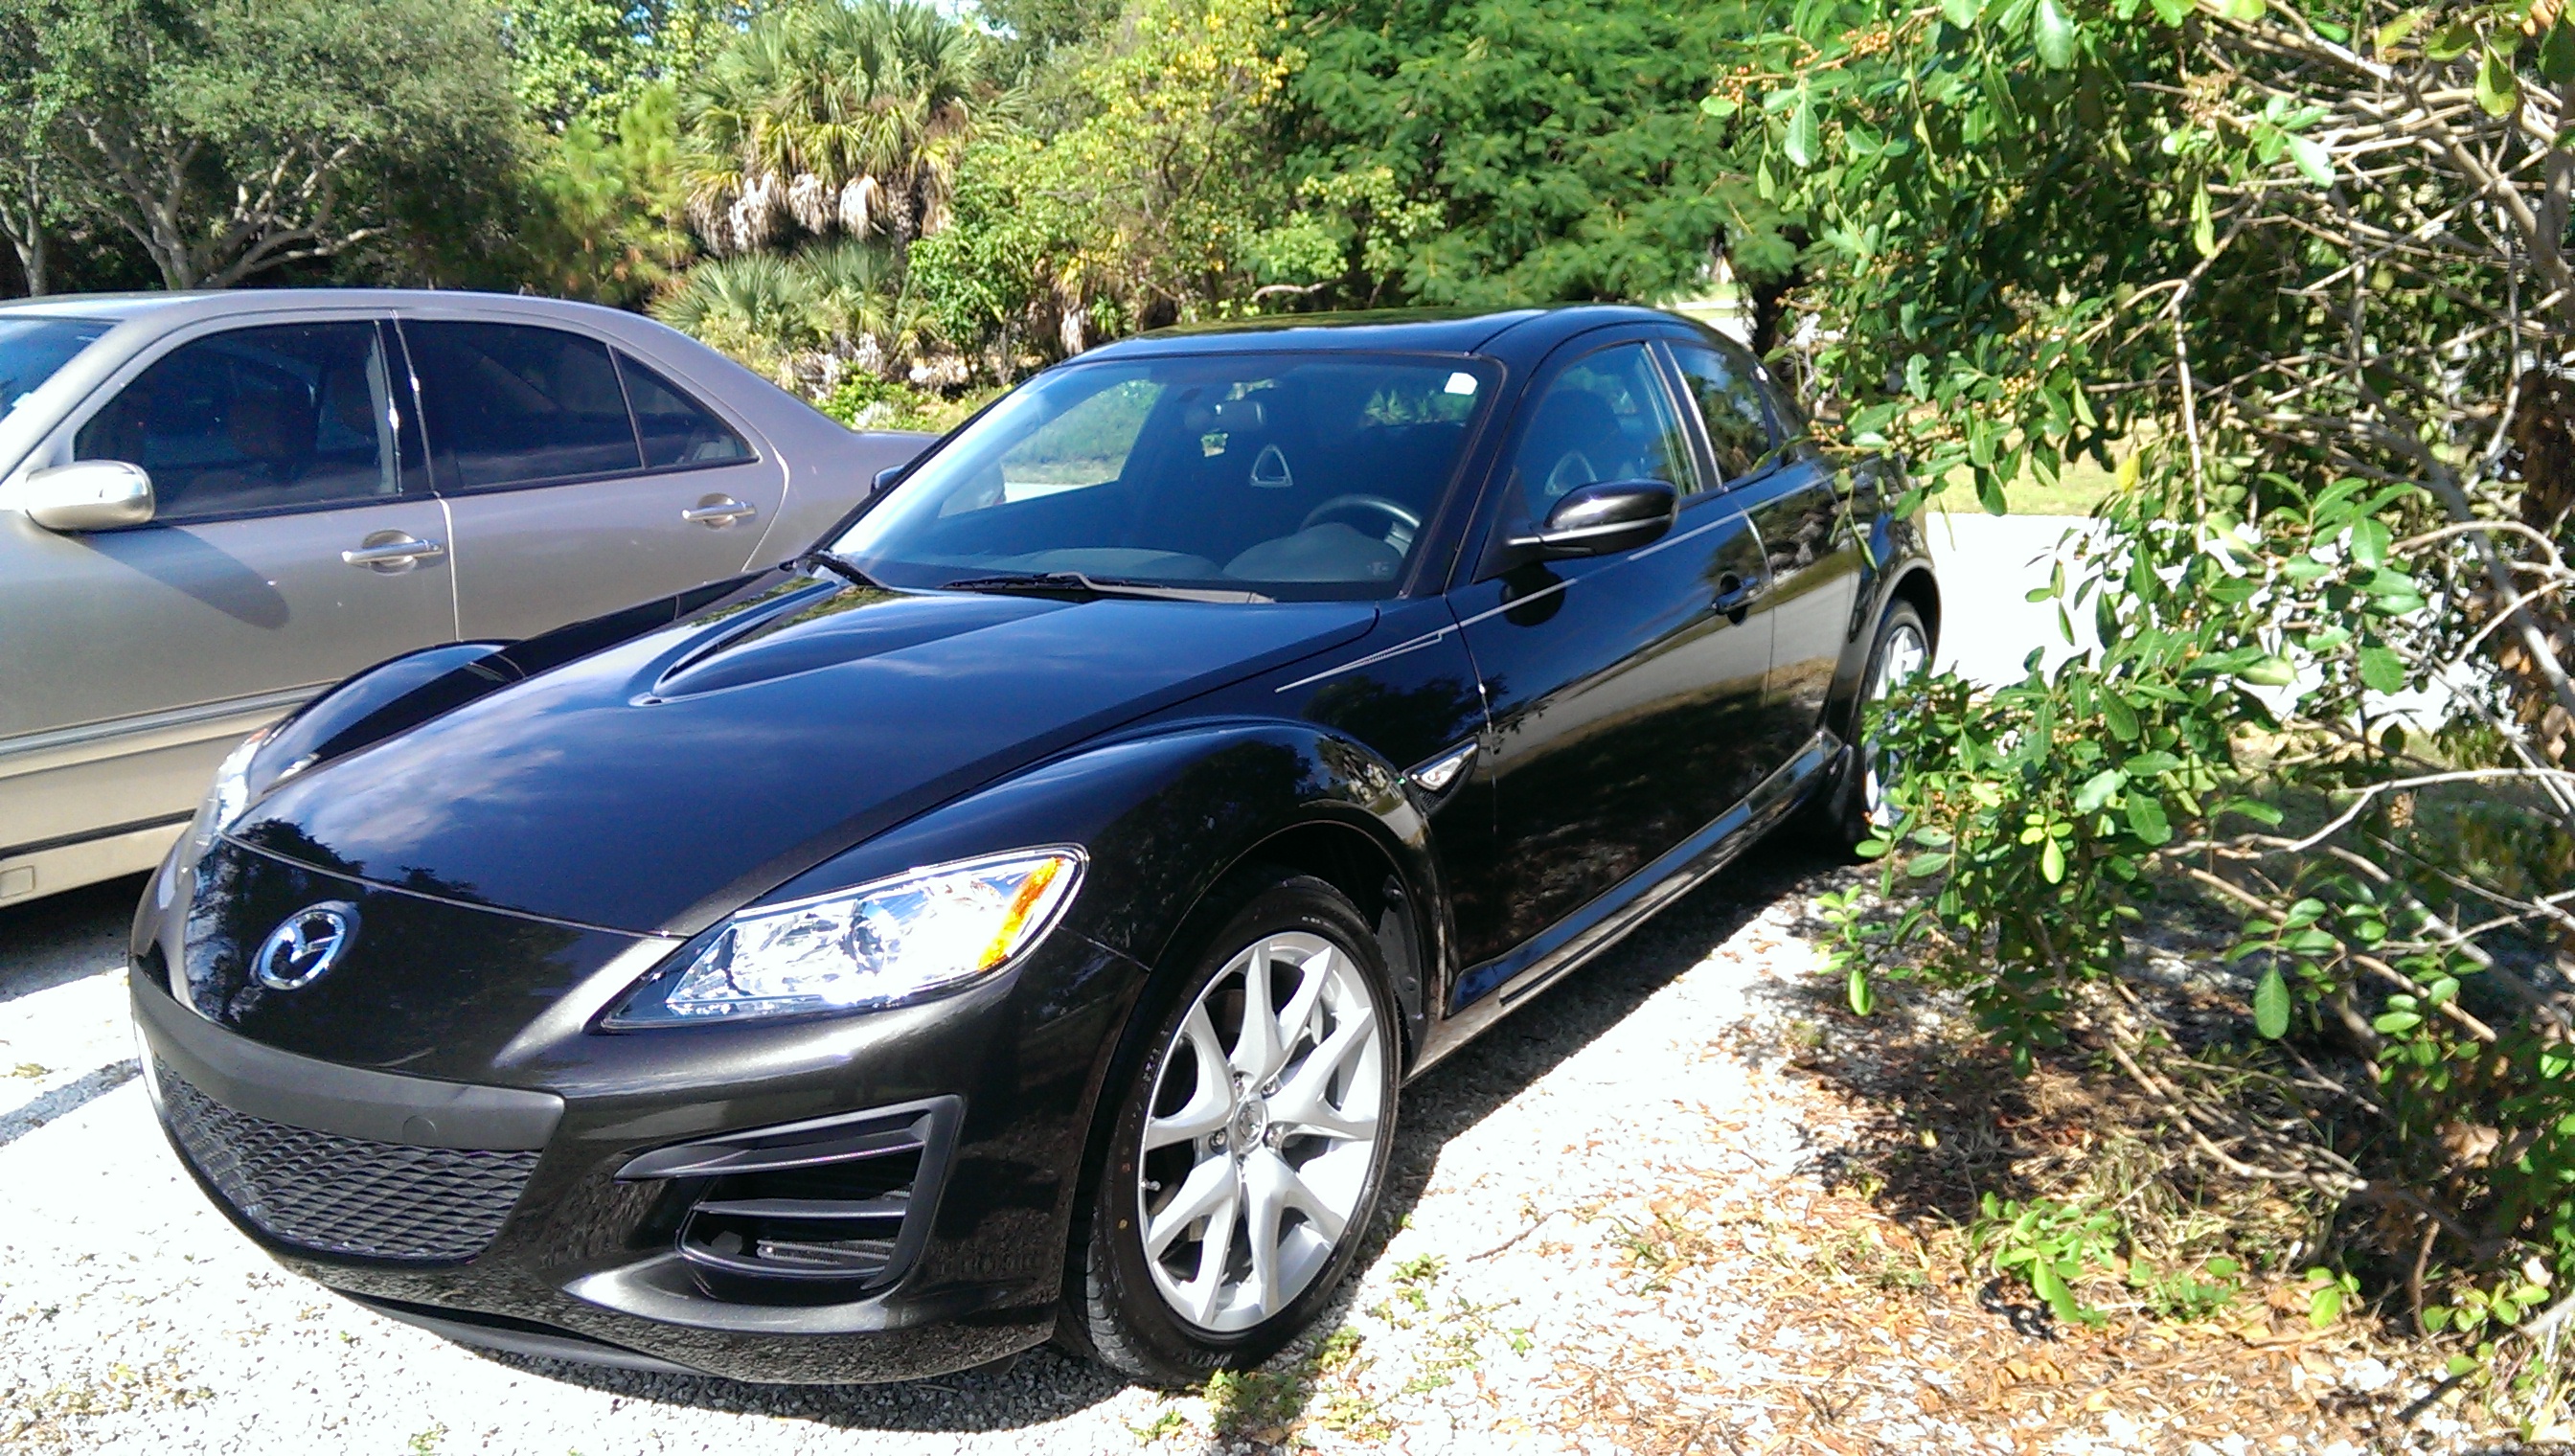
For a few years now I’ve been collecting data about gas fill ups for my RX-8. I knew before I got the car it was going to get poor mileage due to its rotary engine. Luckily I drive a relatively low number of miles per year, and the car offers some cheap thrills with the 9.4K rpm fuel cut-off. I’m also quite partial to the engine because of its uniqueness and quirkiness. It’ll probably never be put in a production car again (for good reasons). Nonetheless I was curious to see what exact mileage I was getting, and how it would change with different usage patterns.
This dataset is a nice place to start showing some of the tools used in data science. A link to the Python code in a Jupyter Notebook can be found on my github page. I’ll present a few of the results here sans the code.
The data was initially saved in a Google Docs spreadsheet: the date, miles driven since last fill up, amount of gas pumped into the tank, the price per gallon, and gas station. Each time the tank was filled up completely, allowing the average miles per gallon to be computed over the past tank. There is some noise to be expected since the pumps may not all be calibrated quite the same way and may not fill the tank up to the exact same amount each time. At the time of writing, there are 114 observations.
Modern cars have trip computers that can record a lot more data and give an instantaneous mileage calculation. It would be interesting to have that much data and take different factors into account, such as air temperature, tire pressure, etc. The biggest source of variation in mileage for my driving pattern is likely the number of cold starts in a day, of which I did not collect data. The car dumps a lot of excess fuel when it’s warming up to operating temperature. The data isn’t ideal, so it’s interesting to see what can be learned from it.
Gas Prices
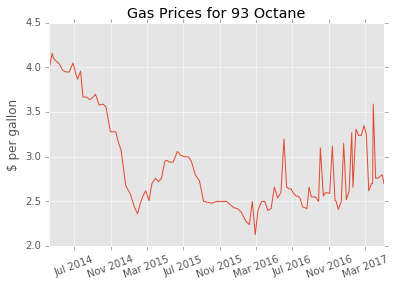
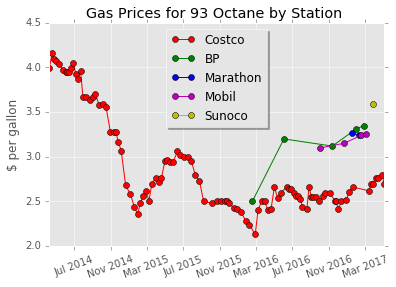
The easiest thing to analyze is the data for the gas prices. The first graph on the left is a time plot of the prices. This plot alone would be misleading. Prices around July 2016 suddenly get very volatile, and one might conclude that the market was itself volatile. However, the underlying reason is that I broke my discipline of only filling up at Costco, which is significantly cheaper than other stations.
As an aside, I’ve wondered whether Costco had poorer quality gas to go along with the cut rate pricing. Supposedly gas stations use gas that comes out of the same refineries/pipelines, with the difference being the detergents or other additives they use. There’s a licensing body called Top Tier that Costco belongs to, which claims they use respectable additives. I’ve also heard that what might really be a problem is the condition of the tanks that a particular gas station uses, e.g., they might have leaks, or contain a lot of water or sediment contaminating the gas. This Costco station seems pretty well maintained, and they churn through a lot of gas, so I don’t expect that to be an issue.
Getting back to the data, it looks like Costco was consistently about $0.64 cheaper than the other stations. Another thing to keep in mind is that other stations have a credit card surcharge, which I was getting hit with too. On average I’d fill up 12.7 gallons, which means Costco would save me about $8.22 per fill up. The Costco membership is $55 per year, and on average I’d fill up every 10 days, so that means I’d recover the cost of membership in 70 days. After that, if I filled up exclusively at Costco, I’d save about $238 per year. The station is on my regular route home, so I don’t waste gas getting to and from there. Almost makes it worth dealing with the lines and pushy people.
Gas Mileage
The mean mileage is 14.2 mpg; pretty embarrassing. On the plus side I drive only about 7,000 miles a year. Still, sorry Earth.
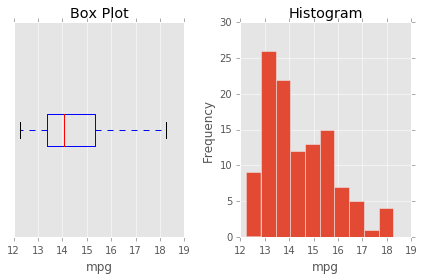 The histogram appears to be bimodal (two humps), rather than a nice looking unimodal normal-looking distribution. Here’s the mileage history.
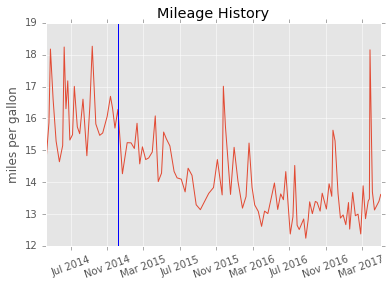 The mileage appears to drop off around late 2014. I’ll get back to that shortly. We would expect the spikes in the graph to correspond to highway driving.
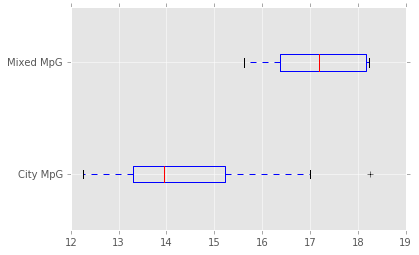
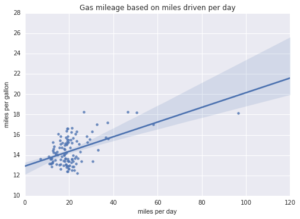
To determine if a tank of gas corresponded to highway driving, I figured that the number of miles driven per day (mpd) would be a predictor. For example, if I drove 150 miles per day over a tank, I was probably hitting the highway. Unfortunately I never drove on the highway much with this car; knowing the mileage was bad I decided to use others in that situation. I used an arbitrary cutoff of 35 mpd to distinguish between city driving and mixed highway/city driving.
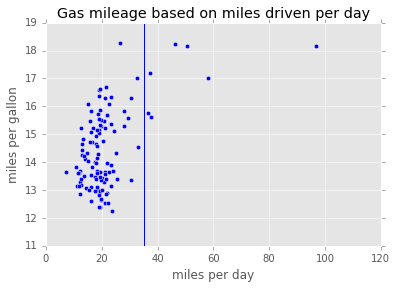
Generally we see that a higher mpd corresponds to a higher mpg, as we’d expect. Here’s a least squares linear regression. The data is overly clustered, so we don’t get a great model.
 New Tires

Let’s go back to that blue line in the mileage history graph. In December 2014 I put on new tires: Bridgestone Potenza S-04 Pole Position. These fall in the max summer performance category. The original tires were also summer tires, but apparently these new ones get worse mileage. I was a little shocked at first, but I figured out the likely cause is that they have a stickier compound and higher rolling resistance. Let’s revisit some of these graphs again while separating the new tires from the old.
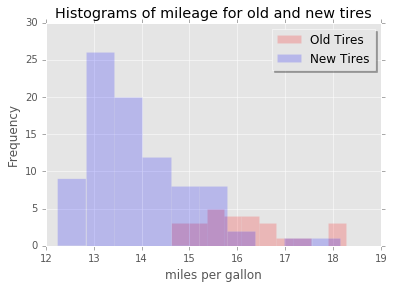 The new histograms explain the bimodal distribution we saw earlier. It should really be thought of as two separate distributions. There are many more observations for the new tires compared to the old tires (87 to 27).
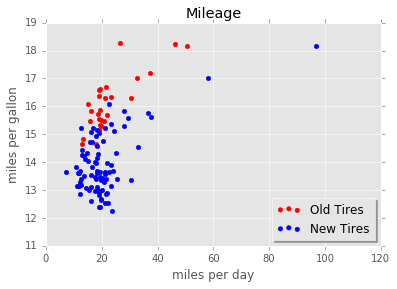
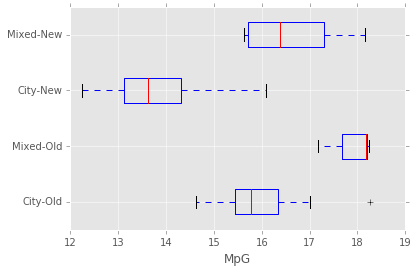
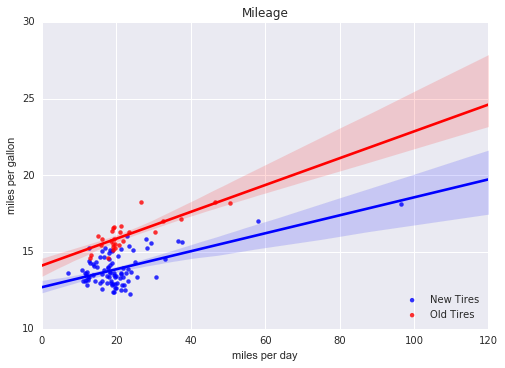
The mean difference between the old and new tires is 2.2 mpg. Is this statistically significant? This is a sensitive question, and one could cast doubt on the independence of the observations. Nonetheless, if we slap the data into a Welch’s t-test, we get a p-value of 7.83e-13. Pretty low! However, p-values are perhaps not that desirable. We can also compute the 95% confidence interval for the difference of the two means: (1.76, 2.67). I think the visualizations really tell the important story though. Here are linear regressions broken across the two categories of tires.
 For the 16,000 miles I put on the new tires, I calculated that I would’ve saved about $422 if I had gotten the same mileage as the old tires. Certainly an extra cost to keep in mind when buying new tires! I’m not sure I actually got any more driving satisfaction out of the extra grip provided by these performance tires. To make things worse, the treadwear is abysmal, and I’ll be lucky if I get 20,000 miles out of them before replacement.
From the data, I can see that the type of tires has probably affected my mileage more than anything else. There’s a minor increase with mixed city/highway driving over just city, but nothing spectacular. If I ever have a significant commute where I have to put on a lot of miles, I think I’ll just keep my RX-8 as the weekend car!